


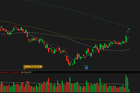
I follow a few professional traders who keep their charts pretty clean. Below is the Daily Chart for ETH. The dotted lines from bottom up are the 50 SMA, 100 SMA, and 200 SMA (the pro’s say institutions pay attention to these).
They also say how the price gets to a point is important. It bounced around the 100 SMA for a bit then rocketed off it on Wednesday with huge volume. The key is the follow through the next day also with massive volume. This is confirmation.
The yellow horizontal line in the volume area if the 50 day volume average.
I know people think TA is BS, but the guys I know make a great living off of it.
Those recent 2 volume bars are 100% institutions, retail can never move a market like that. Volume is one of the few area where institutions cannot hide their moves. Add that with associated big bullish price moves and buckle up.
IMO, this is fantastic for ETH.
submitted by /u/Jeff1383 [link] [comments]
r/CryptoCurrencyRead More
You might also be interested in reading SBI, Rakuten, Nomura line up to launch crypto investment trusts: Report.