


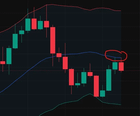
Recently came across this pattern and it’s concerning for Bitcoin holders to say the least. This is the Monthly Bitcoin chart. I’m using an indicator called Bollinger Bands. The blue line is the mean and the red and green lines are 2 standard deviations from this mean. To have price reject this mean twice on such a significant timeframe is a strong indication of a larger bearish trend starting. The recent hack may have just provided the narrative for the market to follow through on this trend.
However, this is just one indicator and just one timeframe, though the others don’t paint a much better picture for what’s to come. Technical analysis doesn’t always work. The hack could be the narrative the market uses to REVERSE this double rejection.
Finally I want to say, while technical analysis is no where near a perfect indicator of future price movements, the market does not do these things accidentally. This indicator is widely known and used, algorithms are programmed to take these levels into account.
Wondering what you guys think when you see something like this, I know many of you are long term holders and are open to some volatility.
submitted by /u/FinePerformance1046 [link] [comments]
r/CryptoCurrencyRead More
You might also be interested in reading Crypto lender Genesis lays off 30% more staff: Report.