


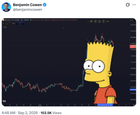
Analysts flagged a Bart Simpson pattern on Bitcoin’s 4-hour chart this week. Sharp spike, flat range, snap back to where it started. BTC is around $77,281 now.
What I keep getting stuck on is whether the pattern means anything or whether it’s just a shape we notice after the fact.
submitted by /u/Kayyy_31 [link] [comments]
r/CryptoCurrencyRead More
You might also be interested in reading NFT marketplace OpenSea to disable royalty enforcement tool.