


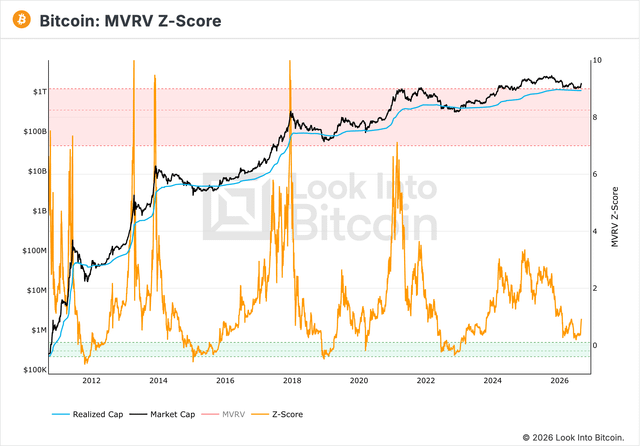
I expected this bounce to stop around 70k. But it went much higher and kept going. I thought there would be one more drop before this cycle really hit bottom. After watching the data for a week, I changed my mind. For the past few days, I’ve mostly just been watching the MVRV Z-Score.
In the past, bull market tops always pushed this indicator into the red zone. And bear market bottoms always pushed it into the green zone. Last cycle broke that pattern completely. The top happened without ever touching red. In June, we got close to green, near zero, but never fully reached it either. If the last top happened without touching red, why can’t this bottom start a new upward move without touching green? My guess is that as Bitcoin’s market gets bigger, these swings get smaller each cycle.
There’s also a pattern in how this indicator moves when the market changes from bear to bull. It usually goes almost straight up, then moves sideways for a while, then keeps climbing. Right now, it’s starting to look like that same straight-up move. If this pattern is right, the real bottom might already be behind us, somewhere around 57k.
Not everything matches perfectly. Bear market bottoms usually come with a big jump in trading volume, and we haven’t seen that this time. But the last bull top didn’t match every signal either before it turned into a bear market. So I’m not using “the data isn’t complete” as a reason to ignore what’s actually changing.
There’s probably still one more small drop coming. But it will probably be a smaller shake-up, not a big flush down.
submitted by /u/ruby-cos [link] [comments]
r/CryptoCurrencyRead More
You might also be interested in reading A Dual Tech Saga: Disruptive Trends From ETHDenver And MWC.