

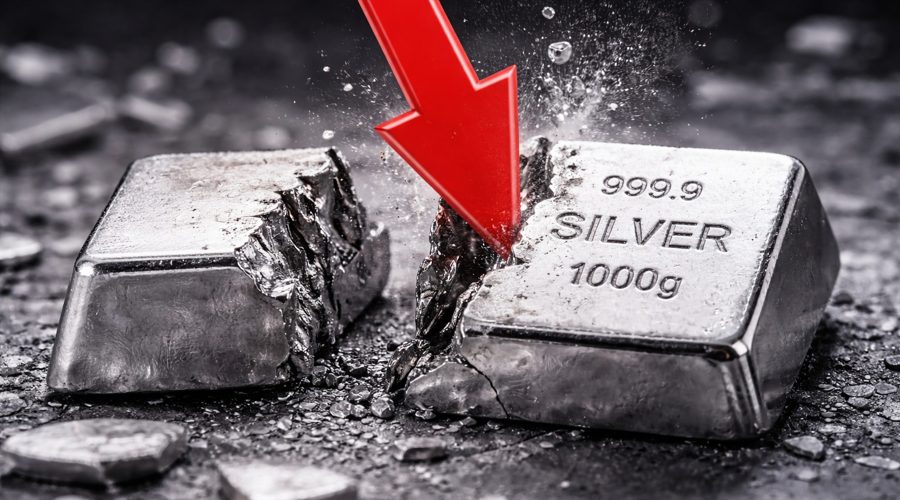
Silver is trading at $64 per ounce on Wednesday, 10 June, 2026, the lowest price in three months, as a confluence of macro headwinds and technical deterioration pushes the white metal into what analysts now classify as a confirmed downtrend.
The silver price is going down for the second straight week, shedding nearly 6% so far this week alone after losing 10% the week before. For context, silver hit an all-time high above $120 per ounce in late January, meaning the metal has shed nearly half its value in less than five months.
Why Silver Is Falling Today? Macro Drivers
The drop mirrors a broader selloff in precious metals. Gold has been falling since last week, trading below $4,200 per ounce Wednesday and deepening its own three-month lows. The catalyst for both moves was a blowout US jobs report released on June 6, which showed nonfarm payrolls rising 172,000 – more than twice the 85,000 expected – according to the Bureau of Labor Statistics.
The mechanics behind why the silver price is going down extend well beyond one jobs report. Several forces have been compounding since early 2026:
Bas Kooijman, CEO and co-founder of DHF Capital, put it plainly: “Silver prices stabilized to a certain extent after a decline last week. The metal benefited from a retreat in the US dollar and bond yields following a decline in oil prices and inflation fears to some extent.”
He added that “the monetary policy backdrop continues to present challenges for silver,” noting that a return to Middle East tensions “could lift oil prices and bond yields and weigh on silver” – a scenario that appears to be playing out precisely.
Silver Price Technical Analysis: The 200 EMA Break
The most consequential technical development this week is the break of the 200-day exponential moving average (200 EMA), a threshold widely regarded as the dividing line between bull and bear regimes.
This is the first time silver has traded beneath that level since mid-April 2025 – a stretch of more than 13 months during which the metal rallied from around $30 to its January peak above $120, a gain of roughly 300%.
To put that into perspective: in April 2025, the 200 EMA break proved short-lived, quickly reversed as bulls defended the level. A similar brief test occurred around the turn of 2025, when silver dipped below the average only to bounce. The last sustained period below the 200 EMA before this week goes back to July 2023 – nearly three years ago – which illustrates just how powerful and durable the silver bull market was.
The break is not merely a data point. It signals that the structural floor supporting the rally has given way.
The Consolidation Zone Is Gone
For most of the period from early February through the end of May, silver had been oscillating in a well-defined range, broadly between $67 and just below $89.
That zone served as a consolidation base after the violent crash from the January all-time high above $120 to below $60 in a matter of weeks, a selloff triggered by a perfect storm of hawkish Fed news and forced liquidations.
This week’s move below the 200 EMA has broken out of that consolidation zone entirely. When multiple layers of support converge at the same price level – in this case the 200 EMA, the lower boundary of the February-to-May range, and prior structural highs – traders call it a “confluence.” Breaking that confluence now opens the chart to a fresh leg lower.
This is a significant regime shift. Earlier this year, the inverted head and shoulders pattern that had been forming suggested a run back toward $120, with May’s partial recovery toward $89 reviving that idea briefly. That scenario is now off the table, with the trend officially flipping bearish.
Silver Price Hi-Lo: Key Levels to Watch
Here is where the XAGUSD hi-lo picture stands right now, and the levels that will define price action in the weeks ahead:
The $61 level will be the first test. That level represents the year-to-date low set in March, and a failure there would shift attention toward $55 – the zone carved by October and November 2025 highs, which now serve as major structural support.
The primary bear case places the downside target at approximately $46 per ounce, corresponding to the late-October 2025 lows. From the current $64 level, that represents a decline of roughly 28%. It is worth remembering that silver fell from $121 to below $60 inside of weeks earlier this year, so moves of this magnitude are not without precedent in this market.
How Low Can Silver Go? Fibonacci Extension Points to $30
Applying Fibonacci extension analysis to the current move offers a more extreme – though not impossible – scenario. Using the decline from the January all-time high to the March lows as the base leg, and then projecting from the subsequent recovery that took silver back toward $89 in early May, the 100% Fibonacci extension of that corrective structure falls just below $30 per ounce.
That level aligns with the April 2025 lows – the price level from which the entire rally to $120 began. A return there would represent a 56% decline from current prices and would essentially erase the entire historic silver rally of 2025-2026.
While that is the outer boundary of the bear case rather than the base scenario, the technical structure does not rule it out if key intermediate supports at $55 and $46 give way without resistance.
Previous analyses from March 2026 had already flagged $55 as the key bear target, a level that is now the next major stop on the chart if the current breakdown continues.
The industrial demand argument has not disappeared. Silver’s use in solar panels, EV components, and AI data center infrastructure remains a structural tailwind that distinguishes it from gold.
How high silver could go was a key discussion point just a few months ago, when $240 targets were being floated. That conversation now takes a back seat to the question of where the floor is.
For traders accessing silver through CFD brokers, the heightened volatility cuts both ways – OANDA Japan was forced to slash leverage and order sizes during January’s record price swings, a reminder that extreme silver volatility has direct consequences for broker risk management.
What Would Reverse the Trend?
A sustained bearish outlook is not guaranteed. Several catalysts could shift the picture:
A US-Iran peace deal that reduces oil price pressure, eases inflation fears, and gives the Fed room to hold or cut rates A dovish Fed pivot or weaker-than-expected inflation data pulling rate-hike expectations back below 30% A sharp US dollar reversal reducing the cost of holding silver for international buyers Industrial demand data showing supply deficits tightening faster than macro headwinds can weaken the priceAs Kooijman noted, “any clear progress toward a diplomatic resolution in the Middle East could help reduce the pressure on silver.” The metal’s dual nature – part safe-haven, part industrial input – means the catalysts for a recovery could come from either direction.
But until one of those catalysts materializes, the chart suggests the path of least resistance remains lower.
FAQ, Silver Price Analysis
Why is the silver price falling today?
Silver is falling because the metal broke below its 200-day exponential moving average this week for the first time since April 2025. The trigger was a stronger-than-expected US jobs report on June 6, which doubled market expectations, pushed Federal Reserve rate-hike odds above 50%, lifted Treasury yields, and strengthened the US dollar – all factors that raise the cost of holding non-yielding assets like silver.
How low can silver go?
The primary bear target from current levels of $64 is $46 per ounce – the late-October 2025 lows – representing a potential further decline of around 28%. A Fibonacci extension analysis applied to the corrective structure from January’s all-time high projects an outer target just below $30, which would mark a 56% decline from current prices. The next key intermediate support before $46 is $55.
What is the silver price prediction for 2026?
Institutional forecasts remain wide. JPMorgan’s range of $60 to $90 for 2026 still technically encompasses current levels, while some analysts surveyed by Yahoo Finance expect a year-end price above $80. More aggressive bull cases from Bank of America ($135-$309) assume a return to the structural bull market. The technical picture, however, now points to the $46-$55 zone as the near-term destination, with $30 as a tail-risk scenario if major supports break.
Is silver still a good investment in 2026?
Silver retains long-term structural support from industrial demand in solar, EV, and data center applications. However, the near-term macro environment – rising interest rates, a strong dollar, and elevated energy prices – is creating significant headwinds. Any investor assessing silver should factor in the broken technical structure and the possibility of continued price weakness before the industrial demand thesis reasserts itself.
This article was written by Damian Chmiel at www.financemagnates.com.TrendingRead More
You might also be interested in reading Secure Futures Obtains $15.2 Million Commitment to Finance Commercial Solar Power Projects in Virginia.